It’s taken me a while to get back to it, but here is another instalment of my review of the ABS Arts and Culture statistics for 2010 (previously referred to here and here).
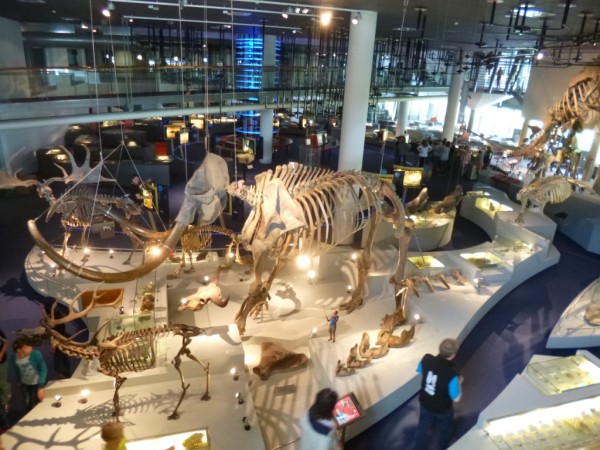
Chapter 8 gets into museum attendance in more detail, breaking down visits to Art Galleries, Social History Museums, Historic Properties, and Natural, Science & Other Museums (in some cases categorised as ‘Art Galleries’ and ‘Everything Else’).
The ABS recognises a total of 1183 museums across Australia; 14% of which are Art Museums/ Public Galleries. The most common museum type is Social History Museums, comprising some 60% of the total.
In the 12 months leading up to when data were collected, 7.2 million people aged 15 years or over (45% of the population) visited museums or art galleries. (This figure and the age breakdowns are essentially the same as reported previously, so I won’t elaborate again here).
Approximately 55% of these museum and gallery visitors were women. The proportion of women rises to 57% in art galleries, falling to an average 53% to all other museums types.
The statistics also report total number of admissions to each museum type, and whether they are paid or free admissions, and I’ve reproduced and manipulated these figures (summarised below) to see what would emerge.

NB: The base numbers this table is derived from came with a health warning, as things like free admissions are notoriously difficult to measure with confidence. There are also a number of caveats associated with the reported number of each museum type – so interpret these data with caution!
The first thing I did was take the reported figures for free and paid admission and see how the proportions of each compared by museum type. As you can see, Art Galleries lead the charge with 83% of admissions being free, whereas only 31% of entries at Historic Properties were free. (Given the typical operational and funding models of these respective organisations, there is no real surprise there).
Then I took the attendance figures and divided them by the number of museums in each category, to get a mean attendance for each. Taking this very crude measure, an ‘average’ Art Gallery attracts 78,500 visits a year and Natural/ Science/ Other museums attract 89,200 on average. This compares to 12,300 at Social History museums and 15,100 at Historic Properties. Again this makes intuitive sense, given the majority of the big state and national museums fall into one of the former two categories.
The final thing I did was to see what ‘share’ of the total museum attendance each museum type was attracting. This essentially reflects the same data but just in a slightly different way – and it shows that Art Galleries and Natural/ Science/ Other museums attract about 3x more visitors than if visitation were spread evenly among all museum types.
Ok, so no real surprises in those numbers. The real surprise for today came from back in Chapter 5, which was about employee earnings and hours worked in the cultural sector.
There are statistics for full-time adult non-managerial employees (i.e. excludes self-employed) in the broader ‘cultural’ sector. So pretty broad-brush stuff, but still some stark results. In the category of ‘arts professionals’ (which is not defined more specifically in this report), it reports that in August 2008 males were working an average of 33.2 hours per week, and earning $1,454 (in other words, $43.80/hr). By way of contrast, females at the same time were working 35.1 hours per week and earning $967 ($27.55 / hr). So for ostensibly the same category of work, women are earning only 63% as much as men.
The category is so general as to make it hard to draw conclusions, but the gap is so great it’s hard to interpret it in any other way but that women in the arts are being seriously underpaid relative to their male counterparts. And for a sector that has a reputation for being female-dominated, that really shocked me.
I can’t decide if I’m shocked or not shocked at that pay difference. I mean, I’m shocked that it is SO different but perhaps not shocked that it is different. I wonder if it is just down to seniority positions or if it goes deeper than that…
Thanks again for helping me (and others) make sense of this document!
Hi Jen,
I agree it’s the scale of difference, rather than the disparity itself, which is the surprising bit. But also don’t want to put too much stock in it because it *is* such a general figure and who knows what hidden factors are in play to get to this final number. And one of the other categories in the list was slightly (slightly!) in women’s favour.
Regan
Great post, Regan
Thanks! 🙂
I’m glad people are enjoying my musings.
Interesting related article which I’ve just been forwarded:
http://www.artshub.com.au/au/news-article/opinions/publishing-and-writing/a-poverty-of-inquiry-182955?sc=1
“Government agencies like the ABS are data producers, not data interpreters – they produce information for others to interpret and imbue with meaning. The problem is, interpretation is thin on the ground.”
This explains a lot (to me at least) – reading the ABS report I’ve been surprised at the lack of interpretation of the data, which is why I’ve been making my own attempts to figure out what bits of it might mean. There is obviously more systematic (and expert!) work needed on this front.
Hi Regan
I like the analysis (and the ref to my article!) Your analysis is exactly what I think we need more of.
The earnings gap is even more stark when you compare culture to all occupations (by this I take it the ABS means total wage and salary employment): by my calculations women’s earnings were 89 percent of men’s in all occupations, making the 63% ‘gender earnings gap’ in the arts particularly bad. There has been quite a bit of research undertaken in the USA and the UK about this.
Keep up the good work.
Chris
Hi Chris,
Thanks for the comment. I thought the ‘across the board’ pay gap was somewhere around the 80% mark and it really did startle me to find such a difference in the arts. Do you have any links to the UK or US research? I would be interested in seeing what is known / speculated about the underlying cause.
Cheers
Regan