Beautifully Empty

A few years ago, a significant part of my job was preparing design proposals for prospective clients. As well as addressing the specific selection criteria, part of the art of preparing a good submission was preparing a version of the company portfolio which cast the firm in the best light, given the client’s specific requirements.

Imagery was essential to a good proposal – it could demonstrate, at a glance, how the firm had addressed similar design challenges in the past. Good photographs of past projects also gave proposals a sense of the tangible – a demonstration of ideas that had taken shape in the real world (and something that no amount of words, CAD renderings or concept sketches can really substitute for).

A common source of frustration for me was that many of our stock portfolio images depicted beautifully finished, perfectly lit, crisp, clean . . . empty spaces. This wasn’t necessarily a bad thing for projects where the aesthetic was a big part of the whole point (fine art exhibitions for instance). But I felt they really sold interactive spaces short – even the most interactive and engaging exhibition in the world looks sterile and passive without visitors there to breathe life into it.

There were good reasons why the images were the way they were: most of them were taken opportunistically, at the end of an install – while the ink was still drying, so to speak. Real visitors (not the people in suits and tell-tale name tags from opening night) could be days or sometimes weeks away. And it wasn’t always logistically or economically feasible to come back later to get the perfectly populated photographs in a museum that was several timezones away.

Practical issues aside though, it has since struck me that most images you see in the design or architectural press show spaces where people are conspicuously absent. At points, it borders on the spooky: deserted nightclubs, abandoned restaurants, lobbies where your only company would be the echo of your footsteps. To see what I mean, pick up an architectural magazine at random (or do a google image search under architecture magazine). I did this the other day as an experiment. Out of all the images in the feature articles (I ignored ads ,etc):50 were completely depopulated, 7 had people in them, and another 6 had what I called an ‘arty’ human presence (those long-exposure photographs where the person’s movement blurs them into a sort of semi-existence; ephemeral in relation to the permanence of the building).

Based on these examples, one could be forgiven for thinking that architects see people as a messy inconvenience, ruining their masterpieces. So when architects and designers speak amongst themselves, they airbrush out the public. This has interesting implications for the social and aesthetic role of architecture and design.

Jon Lang, writing 20 years ago*, really put his finger on something when he wrote:

Design professionals have long been rent by two opposing self-images – that of themselves as artists and that of themselves as environmental designers. . . Architects tend to think of buildings as objects and are thus concerned with object perception rather than environment perception. . . They are concerned with buildings as art rather than environments. . . Few architects would place themselves at the extreme ends of an artist-environmental designer scale, but these are two contrasting self-images, with the former being the one promoted by schools of architecture and the press. . . The problem is that few architects or schools of architectural education explicitly recognise this tension. . .

As far as I can tell, this tension has not been resolved in the intervening two decades.

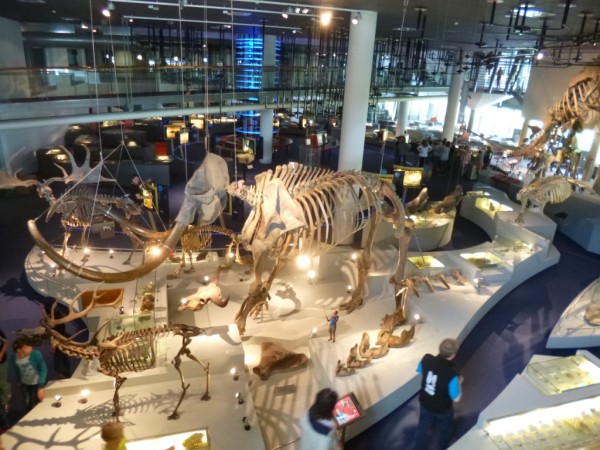
Museums are an interesting case study in considering buildings as art vs. buildings as environments. New museums are often housed in ‘statement’ buildings by celebrity architects, which may or may not be all that easy to live with on a day-to-day operations front.

I should be clear – this is not intended as an anti design rant! Well-planned and executed design adds to our lives. Social research and environmental psychology have shown us that aesthetics are far more than an ‘optional extra’ in our homes, workplaces and public places. But nor is the aesthetic an end in itself: beauty in design helps serve the psychological and social needs of people. And I do wonder where people sit in the order of priorities in ‘statement’ architecture.

*Jon Lang (1991) Design Theory from an Environment and Behavior  Perspective. In Zube, EH & Moore GT (eds) Advances in Environment, Behavior and Design Volume 3. (extracts from p55; emphasis added)


More on museums and social media

When I wrote yesterday’s blog post about Museum Next’s survey about attitudes to social media, I didn’t realise that the study was just one of a series of that Museum Next had recently completed. (As a testament to the value of social media, I was  very quickly made aware of these additional studies when I posted a link to my blog on Twitter.)

There are in fact four surveys:

  • What do people want from museums on Facebook? (results of an online survey)
  • What do museums think Twitter is for? (responses from 361 museum professionals)
  • Museums on Twitter (results of an online survey from non museum professionals)
  • Social Media Audiences and the museum (which was the subject of yesterday’s post)

There are interesting similarities and differences between the results of the different surveys.

Whereas the social media audience survey appears to be of a random sample of UK residents, it looks like the other survey samples were more opportunistic. Thus the age spread does not reflect different age groups’ social media usage (as reported in the first survey), and women outnumber men by nearly 2 to 1! (I’m not sure if this means women are more interested in museums, more inclined to social media, or that they are more likely to complete online surveys, but I digress . . .)

Of the sample, 82% of respondents ‘like’ at least one museum on Facebook and nearly 90% follow at least one Museum on Twitter, with most following several (i.e. This survey population is clearly different from the social media audience survey, where only 10% of respondents were fans or followers. By contrast, this sample is highly aware and engaged, and findings should be considered in light of this).

The reasons respondents gave for liking or following were similar across both Facebook and Twitter, with the top three being: to learn about exhibitions and events (76% Facebook, 98.9% Twitter); to show support for the museum (64% Facebook, 51% Twitter); and to help promote the museum (47% Facebook 35% Twitter). Based on these percentages, people overwhelmingly use Twitter to get information and news about museums, whereas Facebook has a greater promotion / supporting role. This does make intuitive sense given the way that each platform works, in that Twitter is more immediate and open while  Facebook is more about sharing between people you already know. Although interestingly, 93% of people said they would be more likely to visit an exhibition that a friend recommended on Twitter compared to 83% on Facebook, which would seem counter that interpretation.

Roughly half of respondents had visited the museums they liked or followed; a further 35-40% had visited ‘some of them’, indicating that the physical audience and the online audience do not completely overlap. This might mean that a proportion of people are happy to have a purely online relationship with a museum, even if they do not visit in person.  (I would imagine the nonvisiting fans and followers live some distance from the museum, but this could be an incorrect assumption on my part.)

If this is the case, and there is a small but significant proportion of fans and followers who are unlikely to visit in person, this might have interesting implications for museums’ social media strategies – how can social media be used to add value for visitors and non-visitors alike?

Social Media: Implications for Museums

I was recently sent a link to the results of a survey of 500 UK residents, investigating their social media habits and awareness of museums on social media.*

The survey, commissioned by Museum Next, explored respondents’ current social media use as well as their awareness and expectations of museums in this realm.

First, one for the social media sceptics: more than three quarters of respondents said they used social media websites (how ‘social media websites’ was defined for the purpose of this research was not made clear, but more on that later).  And while usage declined with age, this drop in use was nowhere near as marked as some people might expect – just over half of the over 64s used social media (compared to 95% of the 18-24s).

However, the over 64s were far less likely to be a fan or follower of brands on social media – 21% compared to 83% of 16-24s (again, the percentages fell for each age bracket). Put another way, 16-24s are four times as likely as over 64s to interact with brands through social media. This potentially points to an interesting generational shift with respect to how people associate with brands and products (or alternatively says something about which brands have a social media presence, and the target markets of these brands).

In keeping with the “what’s in it for me?” principle, the most common reason for following brands was to access promotions or special offers (54%). Other popular responses related to getting advance information about new products or events (37%), or that the brand supplied interesting content for its followers (33%).

So far, so generic. What does all this mean for museums?

Well, for a start, nearly three quarters of the sample said they attended museums and galleries, and this was roughly evenly spread across ALL the age groups. However, only 18% were aware of museums using social media, and only 10% were a fan or a follower of a museum (i.e. roughly half of those who were aware of museums on social media were fans or followers).

Interestingly, the reasons people gave for following museums were different from those given for ‘brands’, with the most common response being a wish to support or promote the museum (47%), followed by a desire to tell friends about an impressive visit (38%).

However, while 83% of respondents said they would be more likely to visit a museum which had been recommended by a friend (the question doesn’t explicitly state ‘recommend by social media’, but this may have been inferred from the context), 66% thought that their friends would be ‘indifferent’ if they became a fan of a museum on Facebook.

A couple of broader observations about the survey:

Firstly, although most of the questions refer to  ‘social media websites’ generically, it’s not clear how (or indeed if) this term was defined for respondents. I know from experience that there are often different understandings about what constitutes a ‘social media website’, so depending on what was said and how that was interpreted this may have affected the results.

Secondly, the only specific social media platform mentioned (at least in the data published on the website) is Facebook. This may have been the scope of the survey, but personally I would have liked to have seen a bit more unpicking of different social media, in particular Twitter. (I must admit I’m a more prolific Tweeter than Facebooker, and so might be a little biased here!) Moreover, museums are having a growing presence on social media beyond the Big Two of Facebook and Twitter, including YouTube channels Flickr groups.

But then again, given the low awareness of museums’ presence on social media at all, getting the word out there in general must be the first step.

[UPDATE: I have since found out that there are more MuseumNext surveys, which are the subject of a later post]

*Thanks to Mel Loe for passing the info on!


What kind of visitor are you?

I’ve noticed that some of my most popular blog postings are about visitor statistics – who visits, how often, where they come from, educational levels, how old they are, and so on. We use figures like these as benchmarks: they allow us to see trends at-a-glance, quickly compare and contrast different attraction types and different parts of the country, and give us hard data to report to Government, funders and other stakeholders.

But how much do these numbers really tell us about the nature and quality of the visitor experience, and what visitors are looking for from museums and other free-choice learning settings?

In the book Identity and the Visitor Experience, visitor research expert John Falk seeks to look beyond basic demographic categories to see if there are more meaningful ways to characterise visitors, capture their interests and cater for their needs.

He identifies five main categories of visitor “identities”:

  • Explorers: a large proportion of visitors fit into the ‘explorer’ category. Explorers are motivated my their innate curiosity and desire to find out new things. They are likely to ‘follow their nose’ through an exhibition space, and so appreciate choice and control over their visit. They tend to avoid more structured interpretation such as guided tours and audio guides, as they might be too structured and prevent them from following their interest and curiosity. Explorers are the kind of visitors who call learning “fun” (see my previous post on this topic).
  • Facilitators: these visitors are not there for them; they are there to help their companions learn and have a good time. Parents are facilitators when their main reason for visiting is to take their children to see something. The other main category of facilitators are friends and loved ones who are ‘tagging along’ to a museum that their loved ones really want to see, or perhaps they are showing visiting relatives around. Facilitators experience their visit through the eyes and ears of their companions. Facilitating parents in particular will appreciate information readily to hand that helps them guide and answer the questions of their children. On the other hand, facilitating friends and loved ones will appreciate good amenities and perhaps a decent cafe in which they can await their enraptured companions if they run out of stamina (!)
  • Experience seekers: these are visitors who want to feel like they’ve been there, done that and have seen the highlights. An example of an experience seeker would be the visitors to the Louvre whose main purpose for being there is to see the Mona Lisa, take the archetypal photo of themselves next to it, and file it under their list of life’s ‘must do’ experiences that they have now done. When visiting an attraction, Experience Seekers want to know what the highlights are, and how to find them relatively quickly – they are often on a tight schedule with lots of sights to ‘collect’ over the course of their day out.
  • Professionals / Hobbyists: this is a small but significant group of visitors who have come with a particular purpose in mind. They are also the most critical, in that they include fellow museum professionals, designers, educators and leisure professionals who will evaluate all aspects of the visitor experience according to their field of expertise. This group also includes specialists in the subjects presented in exhibitions; teachers who are the lookout for ideas to take into the classroom; and artists seeking creative inspiration. These visitors have higher than average knowledge and are most likely to take advantage of special events and behind-the-scenes tours which allow them to have a more personalised experience away from the crowds.
  • Rechargers: rechargers make up a relatively small proportion of visitors to most museums, but are more likely to be seen at Art Galleries, Botanical Gardens, Aquaria and Natural Reserves. These are people who have come to simply enjoy the space, taking time out from their day-to-day lives. They are more interested in soaking up the general ambience than engaging with specific content. Rechargers are the most sensitive to crowding, as the noise and hubbub created by other visitors interferes with their opportunity to take ‘time out’.

Unlike our age, socioeconomic backgroud or educational level, identity is not a permanent characteristic of visitors. Someone can be an Experience seeker on holiday, a Facilitator when they take their children to a school holiday program at the local museum, an Explorer when satisfying their own curiosity, and a Recharger when taking a break during their lunch hour at a Botanic Garden.

What was your last visit ‘identity’?

* Source: Falk (2009) Identity and the Visitor Experience. Left Coast Press, Walnut Creek CA.

Visits to UK Museums and Attractions: 2010

My April edition of Museums Journal arrived in the post late last week, which included a report on UK visitor statistics that have recently been released by the Association of Leading Visitor Attractions (ALVA).

Topping the list was the British Museum, with over 5.8 million visits, up 4.9% on the previous year. Coming in second was Tate Modern, which saw a 7% increase to see them topping the 5 million visitor mark.

Below are the ALVA figures for (its member) sites attracting over 1,000,000 visitors in 2010 (the full list is here):

  SITE TOTAL VISITS CHARGE/ FREE % +/-
1 British Museum 5,842,138 F +4.9%
2 Tate Modern 5,061,172 F +7%
3 National Gallery 4,954,914 F +3.7%
4 Natural History Museum 4,647,613 F +13.2%
5 Science Museum (South Kensington) 2,751,902 F -0.5%
6 V&A (South Kensington) 2,629,065 F +16%
7 National Maritime Museum 2,419,802 F +2.19%
8 Tower of London (HRP) 2,414,541 C +1.04%
9 St Paul’s Cathedral 1,892,467 F/C +4%
10 National Portrait Gallery 1,819,442 F -7%
11 Tate Britain 1,665,291 F +11%
12 British Library 1,454,612 F +5%
13 Westminster Abbey 1,394,427 F/C -3.8%
14 National Galleries of Scotland (Edinburgh sites) 1,281,465 F/C +10.18%
15 Old Royal Naval College Greenwich 1,274,957 F +28%
16 Edinburgh Castle (Historic Scotland) 1,210,248 F/C +1%
17 Chester Zoo 1,154,285 C -6.8%
18 Royal Botanic Gardens, Kew 1,141,973 C -12.19%
19 Kelvingrove Art Gallery & Museum (Glasgow) 1,070,521 F -21.75%
20 Imperial War Museum (London) 1,069,358 F +21%
21 Roman Baths & Pump Room, Bath 1,054,621 C +2%
22 Canterbury Cathedral 1,033,463 F/C +2%
23 Merseyside Maritime Museum 1,027,475 F +9%
24 ZSL London Zoo 1,011,257 C -4.95%
25 Stonehenge (EH) 1,009,973 C +2%
26 Eden Project 1,000,511 C -2.7%

Overall there is an increase in visitor numbers, but there is considerable variation across sites. The Imperial War Museum,  Natural History Museum and the V&A have all seen large increases (perhaps there were significant redevelopments which opened last year?); others were relatively stable (e.g. the Science Museum and the Tower of London), and others again saw significant decreases in attendance (e.g. National Portrait Gallery and Royal Botanic Gardens, Kew). I was particularly surprised to see the drop in visitors to Kelvingrove Museum (down 21.75%)  – perhaps there is a rebound effect if 2009 was an unsually high year for some reason? If anyone has some details which can help explain the numbers (I feel I’m a bit out of the loop with UK happenings these days), please add your comments below.

It’s probably also worth noting that eight of the top ten attractions have free entry, and apparently UK Culture Minister Ed Vaisey has released figures showing a trebling of visits to free museums since 1990 (MJ, p7).

ALVA do not report whether the increase in visitors is primarily due to local or international visitors (this is probably not recorded at many individual museums). It would be interesting to know whether the increase in museum visits is a manifestation of the ‘staycation’ phenomenon – more people holidaying closer to home in a tighter economy, or more international tourists taking advantage of the relatively weak GBP and visiting the UK.

Australian attendance at cultural venues: trends 1999-2010

Continuing from my last post on the ABS Report: Attendance at Selected Cultural Venues and Events, I’ve now had a look at the historical trends data comparing surveys from 1999, 2005-6 and 2009-10.

First, some caveats: the ABS acknowledge some methodological differences between the three surveys from which these data have been drawn, which may affect the validity of internal comparisons. Also, the report notes that only a minority of the differences between years are statistically significant (more on that later).

Historical attendance trends across selected cultural venues by persons over 15 years of age. (Source: ABS) Figures in red are statistically significant increases.

From 2005-6 to 2009-10, there were statistically significant increases in attendance to Art Galleries, Museums, Botanic Gardens, Performing Arts and Cinemas.  I’ve also represented these historical trends graphically:

Historical attendance trends across selected cultural venues by persons over 15 years of age. (Source: ABS)

This shows that attendance to Art Galleries and Museums is similar, as is that to Zoos, Botanic Gardens and Libraries. Most changes over time are relatively modest, even if some are statistically significant.

However, the state-by-state breakdowns reveal a more complex picture, particularly for museums:

Historical attendance trends to museums by State (Source: ABS)

So while there is a statistically significant increase in attendance overall, the only individual states to show a statistically significant increase from 2005-6 to 2009-10 are Victoria, Queensland and Tasmania. The differences between states are quite stark when shown graphically:

Historical attendance trends to museums by State (Source: ABS)

This graph would seem to suggest that there are long-term, stable differences between states and territories with respect to museum attendance. ACT is the only one to show dramatic changes between time points. (I wonder if the opening of the National Museum of Australia is a contributing factor to the jump from 1999 to 2005-6?) While there does seem to be an upturn in NT attendance, apparently this is not statistically significant.

There were also noticeable state-by-state differences in Art Gallery attendance:

Historical attendance trends to art galleries by State (Source: ABS)

Again, ACT residents appear to buck the national trend. However, it is the increases in the NSW and Qld figures which are statistically significant:

Historical attendance trends to art galleries by State (Source: ABS)

There were no dramatic differences between states with respect to attendance rates to either Zoo & Aquaria or Botanic Gardens. While there was not a statistically significant increase in visits to zoos at the national level, the NT had a statistically significant increase:

(This would appear to go against the theory I had in my last post, that there had been a “Panda effect” increasing zoo visitation in South Australia since 2009.)

For Botanic Gardens, NSW and Victoria had a significant increase; the nationwide total was also statistically significant:

Age breakdowns also give a bit more of an insight as to who the additional visitors are – for Art Galleries, there are statistically significant increases for all the older age brackets (age 45+) . Interestingly, the increase of visitation by the 18-24 age bracket is also statistically significant.

Meanwhile, for museums and zoos, it is only the 35-44 demographic that shows a statistically significant increase. Botanic Gardens, meanwhile, show statistically significant increases among 15-17 year olds, as well as 45-54 year olds.

Australian attendance at cultural venues: state-by-state breakdowns

Last year, I wrote a series of blog posts about the ABS report: Arts and Culture in Australia – a statistical overview. This report did have museum attendance figures, but focused primarily on the funding mix of museums and other cultural venues.

A recent article on the Perth Now website, lamenting the relatively low levels of cultural participation and funding in Western Australia, alerted me to the release of a more recent report, which looks at museum attendance in more detail and gives a state-by-state breakdown.

The full report is available on the ABS website as always, but I thought I’d again take a look at the numbers and give my thoughts on what they might mean (and, as always, I appreciate your comments and additional perspectives!).

First, the headline figures – attendance numbers at cultural venues state-by-state:

Attendance at cultural venues and events 2009-2010 (source: ABS report cited above). *NT figures pertain only to urban areas. **Performing arts includes classical concerts, popular concerts, theatre, dance, musicals and operas. These are broken down in the full report but only the aggregates are used here.

Overall, over 85% of people aged over 15 in Australia attended at least one cultural venue or event for the year 2009-10. For people aged 15-17, participation rates were the highest at 97%. Participation decreased with age, and the lowest participation rate (64%) was that of the over 75s.

Total participation rates (Source: ABS)

Participation rates are also broken down by state and territory:

Cultural participation and attendance rates (percentages), by venue type and by state (Source: ABS)

Based on these figures, ACT residents are among the most active participants in culture, being the most likely to have visited an Art Gallery, Museum, Archive, Library, Performing Arts event or Cinema in the past year. With the high density of National Museums and Galleries in the Capital, the high attendance at these venues is not all that surprising – it’s a matter of availability. However cinemas, hardly unique to Canberra, are well attended as well. (Note that the data records people’s place of residence, not the venue they attended. So these numbers just ACT residents, not people from other states visiting Museums in the Capital. The report gives a breakdown of  where people attended venues in relation to where they live on pp 19-20).

As the Perth Now article said, WA residents are the least likely in the country to attend an Art Gallery; Museum attendance is also below average in that state. Having said that, WA is not alone: participation rates are below average in NSW (albeit slightly) across the board.

NT residents were the most likely to attend zoological parks and aquaria, by a significant margin. SA is above the national average for this year too and I wonder if this is a consistent figure or indicative of the ‘Panda effect’ (the Adelaide Zoo’s Panda Enclosure opened in late 2009 and there has reportedly been a jump in visitor numbers since then.)

Overall what these differences between states mean, it’s hard to tell: it’s possible that they are simply due other geographic and demographic differences between states. However, as the Perth Now article suggests, there could be genuine differences between states and their attitudes to culture. I’d be interested in hearing what you think.

One pointer towards a geographic explanation (at least in part) is the difference in participation rates between capital cities and elsewhere. This is possibly skewing the figures for those states which have a higher proportion of their population residing outside the capital:

Attendance to cultural venues by region (Source: ABS)

The report also gives breakdowns of visitation by age and sex, household composition, country of origin, labour force status, educational attainment and household income, but I won’t delve into those here – if you’re interested in these figures, go to the original report (see link to ABS website above).

Later in the report, they have some figures showing attendance trends over the past 10 years, which I’ll look into for a future post.

‘Fun’ and ‘edutainment’

How many times have you seen slogans along the lines of:

We make [insert ostensibly worthy-but-dull topic here] FUN!!!

Science centres and museums are repeat offenders in this regard. And I’ve always been a bit uncomfortable with this habit, although I haven’t quite been able to put my finger on why. Is it just because it sounds so trite, or is there something deeper at play here?

What is ‘fun’ anyway? Some people think that throwing themselves off a bridge, tethered only by a flexible piece of rope, is the pinnacle of fun and excitement. They part with hundreds of dollars for the privilege. Personally I couldn’t think of anything worse!

When it comes to museum visiting, ‘fun’ is a particularly problematic word. And again, it’s because fun means different things to different people – for some it implies mindless entertainment (and possibly things going ‘bang’); for others it has a more nuanced meaning. To some extent, what people mean by the word ‘fun’ means seems to depend on their age and cultural background.

The lesson here for me is that we have to be careful of the terminology we use (and hear) when speaking to visitors – just because we’re using common language, it doesn’t necessarily mean we’re all talking about the same thing. It makes it even more important that we let visitors describe and elaborate upon things in their own words as much as possible in our research, and avoid too many pre-defined (and maybe inadvertantly loaded) categories.

Having said that, for some visitors at least, museum visiting is something they definitely would describe as ‘fun’ (as this paper by one of my supervisors, Jan Packer, demonstrates). Drawing from visitors’ descriptions and reflections on their experiences in museums and other free choice learning settings, the paper describes five key aspects of learning for ‘fun’ in museums:

  1. Learning for fun encompasses a mixture of discovery, exploration, mental stimulation and excitement.
  2. The majority of visitors to educational leisure settings consider learning to be, more than anything else, enjoyable.
  3. Although most visitors don’t come with a deliberate intention to learn, they do seek or are unconsciously drawn into an experience that incorporates learning.
  4. Visitors identify four conditions (a sense of discovery or fascination; appeal to multiple senses; a sense that the learning happens ‘effortlessly’; availability of choice in the experience) that together are conducive to the learning for fun experience.
  5. Visitors value learning for fun because it is a potentially transformative experience (i.e. it helps people see the world in new ways and appreciate things differently).

Looking at this paper, I think it starts to nail what my problem with the “making xxx FUN!” schtick is. It betrays a lack of confidence in our material, as well as an underestimation of our audiences. It assumes people will only want to engage with the watered-down and sugared-up version of what we have to offer. Yes we need to find ‘hooks’ with which to engage our audience, but this doesn’t necessarily require ‘dumbing down’ (another horrible term!) or sensationalism.

Which brings me to another rather nasty neologism from the museums and science centres world: ‘edutainment’. Several years ago, it was not uncommon to go to a conference presentation where the words ‘education’ and ‘entertainment’ were put at opposite ends of a spectrum.  ‘Education’ was serious, worthy-but-dull stuff; the ‘bitter pill’ which needed sugarcoating by mixing in some whizz-bang, nonchallenging ‘entertainment’. But, as the research shows, Education and Entertainment are not polar opposites!

Entertainment is another word that we need to be careful of, however: it’s not a word that visitors often spontaneously offer up to describe their experience. I’ve read other research (not all of it published) which shows that ‘enjoyment’ is a word that comes up more often.

Either way, when you look at visitor learning in the museum as a function of their stated motivation for visiting, both ‘entertainment’ and ‘education’ motivations are good indicators of learning. That is, those that say they come for enjoyment are just as likely to learn something as those that say they’ve specifically come to learn (e.g.Falk et al, 1998).

So people might come to the museum as some gentle exercise for the mind, considering it an enjoyable way of spending their leisure time, in a similar way that a walk along the waterfront is an enjoyable way to get some exercise for the body. They may not even consider it learning, especially if they define ‘learning’ in terms of being drilled and tested as in formal education. But from a museum’s point of view, learning is exactly what it is.

Yet another reason we need to mind our language.


References:

Falk, J., Moussouri, T. and Coulson, D. (1998) The Effect of Visitors’ Agendas on Museum Learning. Curator, vol 41, no 2, 106-120.

Packer, J (2006). Learning for Fun: The Unique Contribution of Educational Leisure Experiences. Curator vol 49 Issue 3, 329-344

Gone to GoMA

While I was in Brisbane last week, I was surprised to learn that I was sharing a city with Australia’s most visited museum in 2010: the Queensland Art Gallery & Gallery of Modern Art (GOMA), twin museums which together drew crowds of some 1.8 million visitors last year.

Once I found that out, I had to drop by and see what all the fuss was about. GoMA in particular came highly recommended, with its 21st Century: Art in the First Decade Exhibition which dominated the museum’s three (I think!) vast levels.

Rather than give a comprehensive review of such an exhibition (when others can do it far better than me), I thought I’d just take the chance to share some images and general observations.

View of the entrance lobby: the space immediately opens up across multiple storeys, feeling bright and open but also dramatic. The display on the right hand side is a wallpaper made up of NASDAQ figures, and is part of a piece making commentary about the Global Financial Crisis. Beyond are twin slides - and you ask yourself: could I really ride these?? This is an art gallery here!! (You can; but I didn't)

First off, the fact that I can share images at all is probably worthy of a comment in itself: art galleries in particular are often loath to allow photography (usually for copyright or conservation reasons). This might be understandable, but also confers a type of ‘hands-off’ reverence to the experience.

As a society, I think we’re becoming more accustomed to documenting and sharing our experiences through photos via social media and other networks; this ability to share becomes often becomes an integral part of the experience itself. I wonder if this relatively permissive attitude to photography is a contributing factor to making the museum feel more open and welcoming, and consequently appealing to a different type of audience (I think I saw more teenagers in the space of one afternoon than I’ve seen in all my other previous art gallery visits put together – and no they didn’t look like a school group).

Teenage girls at a display which allowed visitors to apply bindis to themselves

Another thing which was unusual in the context of an art gallery: queues. While queues to enter a whole exhibition are common enough, these were queues to see particular exhibits or take part in certain experiences which were only available to small groups of visitors at a time.

I’m usually a studious avoider of queues – probably a sign of an impatient temperament – but since I was on no fixed timetable and was feeling perfectly content to happily wander and lose myself amongst the displays, I did something I almost NEVER do: join a queue when I don’t know what it’s for:


Almost alone in the centre of a large gallery, the brilliantly lit spheres are surrounding a reflective black box that is almost lost in the darkened room; it makes a kind of infinity mirror for the spheres surrounding it. Notice the queue lining the far wall.

The queue was to enter the box in the middle of the room (4 at a time) which closed and surrounded you in a reflective UV space:

The view from inside the box: the floor is a small peninsula surrounded by a layer of water. The UV reflective (ping pong?) balls are suspended by fishing wire.

This was just one of several immersive exhibits, for instance the ‘swimming pool’ which was more than it first seemed:

School children at the bottom of the pool. . . .?
The view from the other side: the water is only an inch or two deep and the rest of the pool is accessed by an almost secretive rear entrance.

As well as the room filled with balloons:


The Balloon Room, or to give it its proper name: Work No. 965: Half the air in a given space (purple) by Martin Creed

This one in particular got me thinking about the blurred boundaries between interactive science and interactive art (in many cases, it’s all in the interpretation). I happened to overhear a young girl say as she left the room: “you could really feel the static electricity in there”, thus spontaneously articulating something which science-based balloon shows have long demonstrated (and may she’s seen that before and made the connection?)

Overall, these exhibits created a sense of fun and delight which you seldom see in the hallowed ground of the art gallery, and in some ways reminded me of the spirit of the science centre. This creates its own challenges – art isn’t made to be bulletproof the same way interactive exhibits are – as was demonstrated by this exhibt made from plastic bags, and which school children couldn’t resist getting under:

The school children loved getting under this installation and pretend to be holding it up while one of their friends took a photograph

But this was one of the few exhibits I saw which was keeping the security guards busy as they tried to direct the enthusiasm of the school kids into non-destructive outlets.

Not all exhibits allowed photography, but I’ll mention just one of these: From here to ear by Celeste Boursier-Mougenot. This installation contained a couple of dozen live finches in a room which incorporated a series of perch structures made from wood, coathangers, harpsichord strings and a sound system. It’s a bit hard to describe but here’s the label which was at the entry to the exhibit:

And that label leads me to my final observation: the technology side of things. The whole museum had free wi-fi access and several exhibits were accompanied by QR codes (like the example above) which allowed you to access podcasts and short movies about particular works. Before this exhibition, I’d never actually got around to experimenting with QR codes. But thanks to the available wi-fi, I managed to download a QR reading app and found it very easy to use. This options also gives you the opportunity to save materials on your phone for future reference.

The 21st Century: Art in the First Decade exhibition closes on April 26. While I wasn’t sure which exhibits were part of that particular exhibition and which might be there on a more permanent basis, I’ll definitely want to visit GoMA again for a second look next time I’m in Brisbane.


It’s the way they make us feel

Things have been quiet here for a few weeks as all my writing energies have gone into producing a chunk of my literature review for my PhD. The good news is that my supervisors think it’s a good start!

So out of all the research and musings I’ve read so far, what’s coming out as the main themes worth exploring in my own research?  What’s struck me so far is the importance of understanding the museum experience from a psychological perspective, in particular the emotional or affective dimension. In other words, it’s not just what museums have to show or to tell, it’s how they make us feel.

People visit museums for all sorts of reasons. Other people don’t visit for all sorts of other reasons. Peel back some of these reasons and you find it’s more about how the museum communicates with us on an emotional level: do we find it relaxing or exhausting? Exhilirating or baffling? Friendly or exclusive? Exploratory or didactic?

Following from this, my interest is how the design of museums (architecturally as well as within different exhibitions) sets up some of these emotional responses, and thus creating an internal mindset well before we’ve had a chance to figure out what the museum is all about on a cognitive, content-centred level.

This perspective creates interesting new territory for visitor research, and an area where we can challenge accusations of ‘dumbing down’ in response to focus groups and front end evaluation, for instance the recent “nastygram” the NY Times gave the Brooklyn Museum.

That post (from the Asking Audiences blog) neatly summarises how focusing on the purely fact-based aspects of an exhibition can have us miss the point:

. . . we’re starting with a narrowly cognitive, educative purpose in mind. We’re interested in what visitors know about [a subject] rather than (for example) what they feel, what they wish, what they fear, what they find beautiful, what they find sad. We’re looking at a single, isolated aspect of human connection to the material. It’s not necessarily the most interesting aspect, but it’s the one that museums, as Enlightenment institutions, have traditionally cared about most.

Based on what I’ve seen in the most recent museum research, the shift from testing facts to exploring feelings already underway. And it’s an area I hope to contribute to.