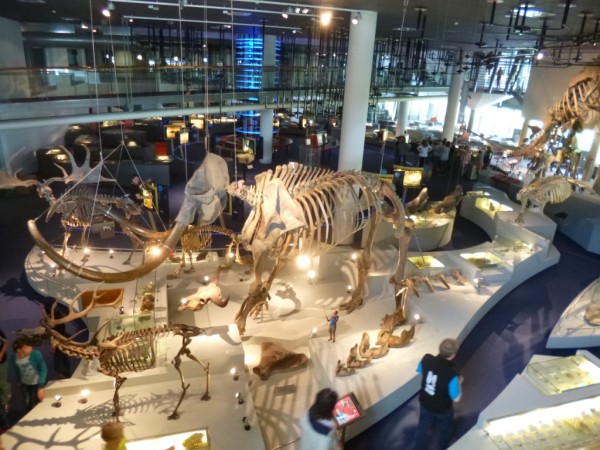
Continuing from my last post on the ABS Report: Attendance at Selected Cultural Venues and Events, I’ve now had a look at the historical trends data comparing surveys from 1999, 2005-6 and 2009-10.
First, some caveats: the ABS acknowledge some methodological differences between the three surveys from which these data have been drawn, which may affect the validity of internal comparisons. Also, the report notes that only a minority of the differences between years are statistically significant (more on that later).

From 2005-6 to 2009-10, there were statistically significant increases in attendance to Art Galleries, Museums, Botanic Gardens, Performing Arts and Cinemas. I’ve also represented these historical trends graphically:

This shows that attendance to Art Galleries and Museums is similar, as is that to Zoos, Botanic Gardens and Libraries. Most changes over time are relatively modest, even if some are statistically significant.
However, the state-by-state breakdowns reveal a more complex picture, particularly for museums:

So while there is a statistically significant increase in attendance overall, the only individual states to show a statistically significant increase from 2005-6 to 2009-10 are Victoria, Queensland and Tasmania. The differences between states are quite stark when shown graphically:

This graph would seem to suggest that there are long-term, stable differences between states and territories with respect to museum attendance. ACT is the only one to show dramatic changes between time points. (I wonder if the opening of the National Museum of Australia is a contributing factor to the jump from 1999 to 2005-6?) While there does seem to be an upturn in NT attendance, apparently this is not statistically significant.
There were also noticeable state-by-state differences in Art Gallery attendance:

Again, ACT residents appear to buck the national trend. However, it is the increases in the NSW and Qld figures which are statistically significant:

There were no dramatic differences between states with respect to attendance rates to either Zoo & Aquaria or Botanic Gardens. While there was not a statistically significant increase in visits to zoos at the national level, the NT had a statistically significant increase:
(This would appear to go against the theory I had in my last post, that there had been a “Panda effect” increasing zoo visitation in South Australia since 2009.)
For Botanic Gardens, NSW and Victoria had a significant increase; the nationwide total was also statistically significant:
Age breakdowns also give a bit more of an insight as to who the additional visitors are – for Art Galleries, there are statistically significant increases for all the older age brackets (age 45+) . Interestingly, the increase of visitation by the 18-24 age bracket is also statistically significant.
Meanwhile, for museums and zoos, it is only the 35-44 demographic that shows a statistically significant increase. Botanic Gardens, meanwhile, show statistically significant increases among 15-17 year olds, as well as 45-54 year olds.


